U.S. GDP Hits 3% in Q2 2025: Unpacking the Numbers Amid Economic Uncertainty
U.S. GDP grew 3% in Q2 2025, but labor slowdowns and trade uncertainties raise caution for future growth. Interactive charts offer sectoral insights.

The U.S. economy posted a 3% annualized growth rate in the second quarter of 2025, according to the Bureau of Economic Analysis (BEA). While this advance estimate indicates steady expansion, economists warn of underlying pressures, including a slowdown in hiring and uneven consumer spending, that could signal a “dark turn” if unresolved.
Understanding the Q2 2025 GDP Advance Estimate
The BEA reported that gross domestic product (GDP) increased at a 3% rate, slightly below the expectations of many analysts who had forecasted a 3.2% rise. The growth was primarily driven by:
-
Consumer Spending: Household consumption increased, particularly in services, but durable goods purchases showed signs of fatigue.
-
Business Investment: Corporate spending on equipment and software rose modestly, though at a slower pace than Q1.
-
Government Expenditures: Federal and state-level spending contributed positively, offsetting some softness in private investment.
Economists caution that while the headline growth appears healthy, the composition reveals areas of concern, particularly labor market trends.
Job Slowdowns and Economic Anxiety
The GDP report coincides with recent data showing a moderation in job growth, with hiring in the manufacturing and retail sectors slowing compared to previous quarters.
Dr. Alan Mitchell, chief economist at the Brookings Institution, noted:
"The 3% GDP figure is respectable on paper, but beneath the surface, the slowdown in employment and wage gains could temper consumer confidence, which is a key driver of future growth."
With inflation gradually easing yet remaining above the Fed’s target, the combination of softer job gains and persistent tariffs on imported goods adds to economic uncertainty.
Sector-by-Sector Analysis
1. Consumer Spending: Services such as healthcare, education, and hospitality led growth. However, durable goods—including cars and appliances—saw weaker demand, reflecting inflationary pressures and higher borrowing costs.
2. Business Investment: Investment in commercial equipment grew at 2.5%, compared with 4% in Q1. Analysts attribute this slowdown to uncertainty over tariffs and supply chain disruptions.
3. Housing and Construction: Residential investment remained sluggish, although modest gains were recorded in multi-family housing, particularly in urban centers.
4. Trade Balance: Exports grew slowly due to weakening demand abroad, while imports increased, reflecting strong domestic consumption but contributing to a negative net trade effect on GDP.
Visualizing the Data
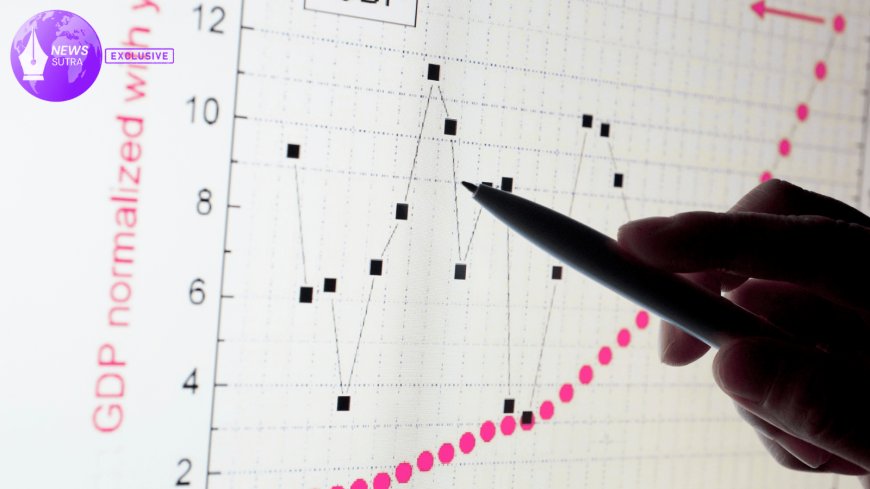
Economists and data analysts are emphasizing the value of interactive charts for understanding quarterly trends. For instance, BEA releases provide downloadable tables that allow comparison of GDP components over multiple quarters. By charting personal consumption expenditures, business investment, and net exports, one can see how each sector influences overall growth.
A recent simulation comparing Q1 and Q2 2025 shows:
-
Consumer spending accounted for approximately 60% of GDP growth.
-
Government spending contributed 15%, while net exports subtracted roughly 5%.
-
Business investment added around 10% to growth.
These visual insights help policymakers, investors, and business leaders understand structural shifts in the economy, not just headline growth rates.
Expert Commentary
Dr. Rebecca Lin, a macroeconomist at the National Bureau of Economic Research, highlighted the nuances behind the headline number:
"GDP growth can mask significant sectoral weakness. If labor market slack persists, and consumer spending softens further, we could see the momentum slow into the third and fourth quarters."
Similarly, Michael Grant, a financial strategist at J.P. Morgan, noted:
"The advance estimate is a useful snapshot, but quarterly revisions could alter the picture. Historically, Q2 estimates are often adjusted upward or downward once detailed data is incorporated."
Economic Outlook
Looking ahead, economists emphasize that policy decisions, global trade dynamics, and domestic consumer confidence will determine whether 3% growth is sustainable.
-
Federal Reserve Policy: Interest rate decisions remain crucial, as borrowing costs influence both consumer spending and business investment.
-
Trade Tensions: Tariffs and international supply chain disruptions could weigh on exports and raise costs for domestic producers.
-
Labor Market Dynamics: Wage growth and employment stability are key indicators of sustainable GDP growth.
Interactive GDP simulations suggest that even with a moderate slowdown in hiring, maintaining consumer confidence and easing supply constraints could sustain growth near the 3% range for the rest of 2025.
Conclusion
The Q2 2025 GDP advance estimate of 3% reflects a U.S. economy that is growing steadily but faces underlying headwinds. Slowing job growth, uneven consumer spending, and global trade uncertainties underscore the need for careful monitoring by policymakers and business leaders.
By examining sectoral contributions and visualizing trends, stakeholders can better assess the economy’s health beyond the headline figure, preparing for potential challenges in the coming quarters.


